What is the Average GPA in College for Undergraduates (by Majors)?
The average GPA for college graduates are highly context-dependent, varying significantly across different schools, fields of study, and even individual courses. Overall, there has been a rising trend in the average GPA scores for college graduates.
For the average High School GPA scores, and Ivy School admission GPAs, please see our Average High School GPA page.
What is the Average GPA in College for Undergraduates?
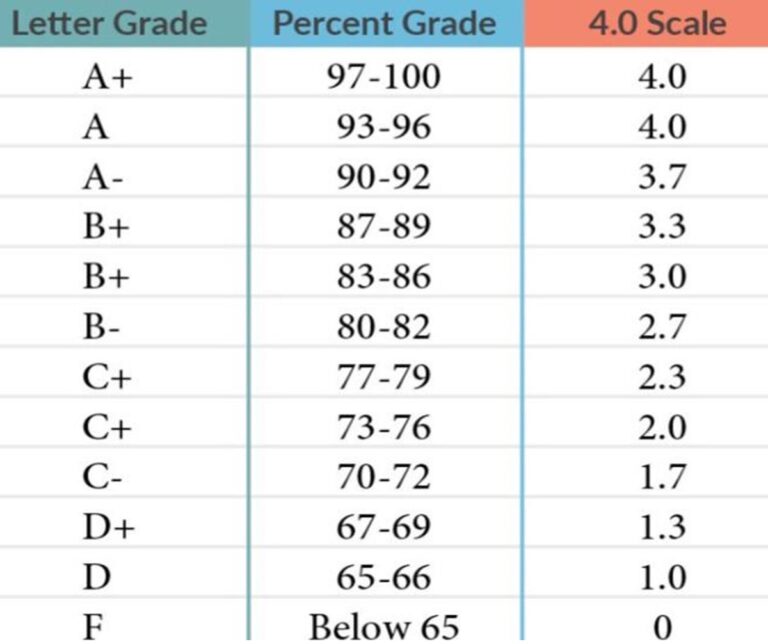
The Average GPA in U.S. Colleges: The average GPA at four-year colleges is approximately 3.28 for U.S. undergraduate students across all majors (Median), according a 2020 study done by the National Center for Education Statistics. The represents an average of almost a B+ grade average, up from an average C grade 20 years ago.
Reasons for Grade Inflation:
-
- Professors may face pressures from student evaluations and parental feedback, influencing them to award higher grades.
- The increasing cost of college education leads students and parents to expect higher grades, equating them with getting their money’s worth.
- Private colleges, with an average GPA of 3.3, tend to have higher GPAs compared to public schools, which have an average of 3.1.
GPA Variation by Major in Colleges:
-
- Science majors, especially Chemistry, typically have lower average GPAs due to the objective nature of their assessments.
- Education majors generally receive higher GPAs, possibly due to more subjective evaluation criteria and less precise right or wrong answers in assignments.
- Grade inflation is more prevalent in non-STEM fields, influenced by factors like student evaluations and expectations for high grades.
- Mathematics majors have the highest median GPA among college disciplines, standing at 3.43.
- Employers and GPA: In 2024, fewer employers are considering GPA as a criterion in the hiring process, with less than 40% of them screening job applicants based on GPA.
- Grad School Admission: GPA requirements for graduate school admissions vary across programs, but a typical minimum GPA requirement is 3.0.
- Institutional GPA Transferability: When transferring to a different college or university, your institutional GPA usually resets. However, grades from all attended institutions will still appear on your transcripts and are factored into your cumulative GPA.
GPA Measurement:
Colleges often provide two GPA measures – a cumulative GPA that includes all courses and a major GPA that focuses only on courses relevant to the student’s major. These can vary significantly based on the institution and the academic program.
What is the Average College GPA (by Major?)
These are the average GPAs in college, sorted by field of study/major (Median, 2020):
Median GPA by Field of Study:
| Undergraduate Field of Study | Median GPA |
|---|---|
|
Computer and information sciences
|
3.23 |
|
Engineering and engineering technology
|
3.24 |
|
Biological and physical science, science tech
|
3.32 |
|
Mathematics
|
3.43 |
|
Agriculture and natural resources
|
3.20 |
|
General studies and other
|
3.11 |
|
Social sciences
|
3.34 |
|
Psychology
|
3.20 |
|
Humanities
|
3.40 |
|
History
|
3.32 |
|
Personal and consumer services
|
3.28 |
|
Manufacturing, construction, repair and transportation
|
3.40 |
|
Military technology and protective services
|
3.10 |
|
Healthcare fields
|
3.35 |
|
Business
|
3.23 |
|
Education
|
3.31 |
|
Architecture
|
3.29 |
|
Communications
|
3.20 |
|
Public administration and human services
|
3.17 |
|
Design and applied arts
|
3.31 |
|
Law and legal studies
|
3.10 |
|
Theology and religious vocations
|
3.40 |
|
Total
|
3.28 |
We have visualized the GPA numbers above, from highest to lowest Median GPA for each college major (Field of Study):

What is the Average College GPA by Majors in 2024?
There are no national data available for for the average college GPAs, sorted by majors in 2024, but we have included the average GPA scores by all fields of study from the University of Wisconsin in 2024, Spring Semester, as a general guide.
These tables summarize the GPA data for undergraduate students by school/college, gender, and academic year. The first table show GPA for Men and Women, Men Only, and Women Only, for the overall field of study, like Business or Engineering, for Freshmen , Sophomores, Juniors and Seniors.
The subsequent tables show average GPA for exact fields of study, like Biochemical Engineering, Chemical Engineering, Civil Engineering, etc.
Table 1: Undergraduate Semester Grade Point Averages – University of Wisconsin-Madison (Second Semester 2023-2024)
Undergraduate Men and Women by School/College
| School/College | Freshmen Count | Sophomores Count | Juniors Count | Seniors Count | Total Count | Freshmen GPA | Sophomores GPA | Juniors GPA | Seniors GPA | Total GPA |
|---|---|---|---|---|---|---|---|---|---|---|
| Agricultural and Life Sciences | 640 | 875 | 1,285 | 2,956 | 5,756 | 3.105 | 3.291 | 3.373 | 3.500 | 3.394 |
| Business | 661 | 915 | 1,407 | 3,164 | 6,147 | 3.183 | 3.344 | 3.428 | 3.555 | 3.447 |
| Education | 474 | 627 | 800 | 2,091 | 3,992 | 3.349 | 3.511 | 3.665 | 3.746 | 3.623 |
| Engineering | 910 | 1,139 | 1,885 | 4,146 | 8,080 | 3.115 | 3.310 | 3.377 | 3.536 | 3.418 |
| Human Ecology | 582 | 683 | 887 | 2,402 | 4,554 | 3.432 | 3.568 | 3.587 | 3.590 | 3.566 |
| Letters and Science | 4,104 | 5,177 | 6,746 | 17,159 | 33,186 | 3.166 | 3.429 | 3.443 | 3.548 | 3.460 |
| Nursing | 174 | 165 | 400 | 831 | 1,570 | 3.309 | 3.476 | 3.485 | 3.464 | 3.450 |
| Pharmacy | 5 | 40 | – | – | 45 | 3.750 | 3.724 | – | – | – |
| Total | 7,545 | 9,586 | 13,450 | 32,794 | 63,375 | 3.211 | 3.412 | 3.452 | 3.554 | 3.465 |
Undergraduate Men by School/College
| School/College | Freshmen Count | Sophomores Count | Juniors Count | Seniors Count | Total Count | Freshmen GPA | Sophomores GPA | Juniors GPA | Seniors GPA | Total GPA |
|---|---|---|---|---|---|---|---|---|---|---|
| Agricultural and Life Sciences | 169 | 266 | 402 | 883 | 1,720 | 3.042 | 3.259 | 3.398 | 3.411 | 3.356 |
| Business | 370 | 496 | 781 | 1,756 | 3,403 | 3.214 | 3.362 | 3.443 | 3.534 | 3.449 |
| Education | 117 | 101 | 185 | 457 | 860 | 3.240 | 3.403 | 3.513 | 3.667 | 3.506 |
| Engineering | 673 | 816 | 1,359 | 2,990 | 5,838 | 3.140 | 3.303 | 3.369 | 3.524 | 3.411 |
| Human Ecology | 148 | 224 | 300 | 745 | 1,417 | 3.218 | 3.465 | 3.476 | 3.437 | 3.433 |
| Letters and Science | 1,933 | 2,534 | 3,379 | 8,398 | 16,244 | 3.109 | 3.405 | 3.372 | 3.467 | 3.398 |
| Nursing | 22 | 25 | 70 | 125 | 242 | 3.097 | 3.547 | 3.503 | 3.357 | 3.410 |
| Pharmacy | 2 | 16 | – | – | 18 | 3.768 | 3.711 | – | – | – |
| Total | 3,432 | 4,464 | 6,492 | 15,372 | 29,760 | 3.137 | 3.376 | 3.390 | 3.488 | 3.409 |
Undergraduate Women by School/College
| School/College | Freshmen Count | Sophomores Count | Juniors Count | Seniors Count | Total Count | Freshmen GPA | Sophomores GPA | Juniors GPA | Seniors GPA | Total GPA |
|---|---|---|---|---|---|---|---|---|---|---|
| Agricultural and Life Sciences | 471 | 609 | 883 | 2,073 | 4,036 | 3.131 | 3.303 | 3.363 | 3.539 | 3.409 |
| Business | 291 | 419 | 626 | 1,408 | 2,744 | 3.135 | 3.320 | 3.410 | 3.583 | 3.446 |
| Education | 357 | 526 | 615 | 1,634 | 3,132 | 3.391 | 3.546 | 3.694 | 3.770 | 3.656 |
| Engineering | 237 | 323 | 526 | 1,156 | 2,242 | 3.064 | 3.329 | 3.397 | 3.565 | 3.437 |
| Human Ecology | 434 | 459 | 587 | 1,657 | 3,137 | 3.515 | 3.601 | 3.640 | 3.664 | 3.623 |
| Letters and Science | 2,171 | 2,643 | 3,367 | 8,761 | 16,942 | 3.219 | 3.451 | 3.511 | 3.626 | 3.517 |
| Nursing | 152 | 140 | 330 | 706 | 1,328 | 3.329 | 3.466 | 3.481 | 3.487 | 3.457 |
| Pharmacy | 3 | 24 | – | – | 27 | 3.737 | 3.733 | – | – | – |
| Total | 4,113 | 5,122 | 6,958 | 17,422 | 33,615 | 3.269 | 3.442 | 3.507 | 3.616 | 3.514 |


hey, just read about the engineering gpa average, is it just me or does it seem a bit higher than expected? anyone else wondering how this compares to like, engineering jobs out there?
Actually the GPA might seem high but remember, theoretical knowledge and practical work can be worlds apart. Higher GPA doesn’t always mean an easier time in the field.
Bet those with the high GPAs can’t fix a printer though, lol.
Wow, seeing how the GPA varies by major really opens up your eyes to the different challenges students face. Kudos to all the hard-working students out there!
everyone’s talking about GPA but does it even matter, like, at all in the real world? got friends with low GPAs doing just fine.
so if i want to go into business, should i be worried about all these GPA stats? or can i just focus on gettin there and figure it out?
It’s always good to be informed, but remember, college is also about growth and finding your path. Focus on your interests and the GPA will follow as you engage with what you love.
Absolutely thrilled to see how well all students are performing across the board! This will be super helpful for my kid deciding on a major. Thanks for the breakdown, i-Ready!