What is a Good SAT Score? What is the Average SAT Score in 2024-2025? SAT Scores Range and Percentiles
See what is a good SAT score, and what is the average SAT score in 2024-2025, here, according to gender, education level, and more. We have also included the SAT score range, SAT percentiles, and SAT score requirements for ivy league schools.
What are SAT Scores?
The Scholastic Assessment Test (SAT) is a standardized test used for college admissions in the United States. SAT scores are a reflection of a student’s readiness for college and are used by admissions committees to compare applicants from a wide variety of high schools and backgrounds. The test measures proficiency in key areas such as reading, writing, and mathematics, which are essential for academic success in college.
SAT scores are used not only to determine eligibility for college admissions but also to award scholarships and assess academic potential. It’s a widely accepted measure for colleges across the U.S., making it a critical part of many students’ college application processes.
SAT Scores Range.
The total SAT score ranges from 400 to 1600, with two main sections: Evidence-Based Reading and Writing (EBRW) and Math. Each section is scored on a scale of 200 to 800.
- Evidence-Based Reading and Writing: 200–800
- Math: 200–800
- Total SAT Score: 400–1600 (sum of the two section scores)
The SAT also has subscores and cross-test scores that provide additional insights into specific skills, but they do not contribute to the main composite score. The maximum composite score a student can achieve is 1600.
SAT Section Scores.
The SAT is broken down into two primary sections:
- Evidence-Based Reading and Writing (EBRW):
- Reading Test: Measures comprehension of written passages, vocabulary in context, and evidence-based reasoning.
- Writing and Language Test: Evaluates grammar, usage, and rhetorical skills through editing and improving passages.
- Math:
- Covers topics like algebra, geometry, trigonometry, data analysis, and problem-solving.
- Divided into two parts: one allowing the use of a calculator and one without.
Both sections are scored on a 200-800 scale. The sum of the EBRW and Math sections gives the overall SAT composite score, which ranges from 400 to 1600.
Understanding Your SAT Score.
Understanding your SAT score involves more than just looking at the total score. Your score report will include detailed information that helps you see how well you did in each section and area tested. Here’s what you need to know:
- Section Scores: You’ll get separate scores for EBRW and Math, each ranging from 200 to 800. These two scores are combined to create your total score.
- Subscores: You’ll receive subscores for specific skill areas such as:
- Command of Evidence
- Words in Context
- Expression of Ideas
- Standard English Conventions
- Heart of Algebra
- Problem-Solving and Data Analysis
These subscores are reported on a scale of 1 to 15 and can help you identify strengths and weaknesses in specific areas.
- Percentiles: The percentile rank tells you how you performed relative to other test-takers. For example, if you score in the 75th percentile, you performed better than 75% of students who took the test.
- Cross-Test Scores: These scores (ranging from 10 to 40) reflect how well you performed on questions related to History/Social Studies and Science, which appear across both the Reading, Writing, and Math sections.
What is the Average SAT Score in 2024?
The average SAT scores for 2024:
According to the College Board, the mean average SAT scores in 2024 were:
- Total score: 1024
- Math: 505
- Reading and Writing: 519
What is a Good SAT Score in 2024?
A “good” SAT score depends on the schools you’re applying to. However, here’s a general guideline:
- Excellent Score: 1450–1600
- Competitive for top-tier schools (Ivy League, Stanford, MIT, etc.)
- Good Score: 1300–1450
- Competitive for highly selective schools
- Above Average: 1150–1300
- Competitive for less selective schools
- Average Score: 1025–1150
- Competitive for many public universities
- Below Average: Below 1025
- May still be acceptable for some schools, but other parts of your application (GPA, essays, extracurriculars) would need to be strong.
Ultimately, a good SAT score is one that meets or exceeds the average score range for your target schools.
Average SAT Scores in 2024 According to Gender, Race and Education Level.
| Category | Number of Test Takers | Percent | Mean ERW Score | Mean Math Score | Met Both Benchmarks | Met ERW Benchmark | Met Math Benchmark | Met None |
|---|---|---|---|---|---|---|---|---|
| Total Test Takers | 1,973,891 | 100% | 519 | 505 | 39% | 62% | 41% | 36% |
| Took Essay | 250,976 | 13% | 495 | 478 | 30% | 54% | 32% | 44% |
| American Indian/Alaska Native | 14,792 | 1% | 449 | 432 | 14% | 35% | 15% | 63% |
| Asian | 200,385 | 10% | 599 | 629 | 74% | 85% | 79% | 11% |
| Black/African American | 228,688 | 12% | 467 | 440 | 18% | 43% | 19% | 56% |
| Hispanic/Latino | 483,640 | 25% | 481 | 458 | 23% | 49% | 25% | 49% |
| Native Hawaiian/Other Pacific Islander | 3,498 | 0% | 475 | 452 | 21% | 47% | 23% | 52% |
| White | 725,962 | 37% | 551 | 532 | 51% | 76% | 52% | 22% |
| Two or More Races | 70,800 | 4% | 556 | 534 | 50% | 75% | 51% | 23% |
| Female | 990,760 | 50% | 522 | 496 | 37% | 64% | 38% | 35% |
| Male | 971,405 | 49% | 516 | 514 | 42% | 60% | 44% | 37% |
| Another/ No Response | 11,726 | 1% | 556 | 511 | 46% | 71% | 47% | 28% |
| English Only | 1,029,787 | 52% | 536 | 514 | 44% | 70% | 45% | 29% |
| English and Another Language | 325,634 | 16% | 534 | 530 | 45% | 66% | 48% | 32% |
| Another Language | 216,476 | 11% | 522 | 537 | 45% | 62% | 50% | 34% |
| No High School Diploma | 115,871 | 6% | 457 | 446 | 18% | 39% | 21% | 59% |
| High School Diploma | 375,167 | 19% | 491 | 470 | 26% | 54% | 28% | 44% |
| Associate Degree | 83,708 | 4% | 512 | 488 | 33% | 64% | 35% | 34% |
| Bachelor’s Degree | 479,404 | 24% | 560 | 548 | 55% | 80% | 57% | 18% |
| Graduate Degree | 401,330 | 20% | 597 | 589 | 68% | 86% | 70% | 12% |
What was the Average SAT Score in 2023?
According to the College Board, the mean average SAT scores in 2023 were:
- Total score: 1028
- Math: 508
- Reading and Writing: 520
Average SAT Scores History for Past Years: 1972-2024.
| Year | Total Average SAT Score |
|---|---|
| 1972 | 1039 |
| 1973 | 1029 |
| 1974 | 1026 |
| 1975 | 1010 |
| 1976 | 1006 |
| 1977 | 1003 |
| 1978 | 1001 |
| 1979 | 998 |
| 1980 | 994 |
| 1981 | 994 |
| 1982 | 997 |
| 1983 | 997 |
| 1984 | 1001 |
| 1985 | 1009 |
| 1986 | 1009 |
| 1987 | 1008 |
| 1988 | 1006 |
| 1989 | 1006 |
| 1990 | 1001 |
| 1991 | 999 |
| 1992 | 1001 |
| 1993 | 1003 |
| 1994 | 1003 |
| 1995 | 1010 |
| 1996 | 1013 |
| 1997 | 1016 |
| 1998 | 1017 |
| 1999 | 1016 |
| 2000 | 1016 |
| 2001 | 1020 |
| 2002 | 1018 |
| 2003 | 1020 |
| 2004 | 1026 |
| 2005 | 1026 |
| 2006 | 1028 |
| 2007 | 1518 |
| 2008 | 1508 |
| 2009 | 1507 |
| 2010 | 1505 |
| 2011 | 1505 |
| 2012 | 1504 |
| 2013 | 1499 |
| 2014 | 1484 |
| 2015 | 1060 |
| 2016 | 1067 |
| 2017 | 1059 |
| 2018 | 1051 |
| 2019 | 1061 |
| 2020 | 1050 |
| 2021 | 1028 |
| 2022 | 1050 |
| 2023 | 1028 |
| 2024 | 1024 |
The SAT scores presented from 1972 to 2024 reveal several key trends and shifts, which can be attributed to changes in the structure of the test, societal factors, and educational policies over the years:
1. SAT Scores in 2007.
- Total Average Score: 1518
- Reason for Change:
- The average SAT score increased significantly in 2007 compared to previous years. This was due in part to a revised SAT format that was introduced in 2005.
- In 2005, the College Board implemented a significant redesign of the SAT, adding a Writing section, and adjusting the structure and scoring method. As a result, the SAT had three main sections: Math, Critical Reading, and Writing, each scored between 200-800, which increased the total possible score from 1600 to 2400.
- The 2007 score increase reflects the new scoring methodology, which inflated the overall numbers, leading to higher total average scores compared to earlier years. The writing section was new and its impact on overall test scores caused a considerable adjustment in the total average.
SAT Scores in 2015.
- Total Average Score: 1060
- Reason for Change:
- By 2015, the SAT had undergone a substantial drop in average scores compared to the inflated values seen in the 2007-2010 period, eventually stabilizing.
- The College Board announced another major revision to the SAT in 2014, with changes rolling out in 2016. The test reverted to a total score range of 1600, combining Math and Evidence-Based Reading and Writing (EBRW), while eliminating the mandatory Writing section.
- The average SAT score of 1060 in 2015 reflects the beginning of this transition, as the test started to align more closely with high school curricula and placed a greater emphasis on skills deemed essential for college readiness.
- The drop in scores also suggests a decrease in overall student performance during the transition period, possibly as students and educators adjusted to the new expectations of the revised test.
SAT Scores in 2024.
- Total Average Score: 1024
- Reason for Change:
- The 2024 average SAT score marks another decrease compared to earlier years, continuing a decline seen post-pandemic, as well as coinciding with the introduction of the digital SAT.
- In 2024, the College Board launched a new version of the SAT that is entirely digital. The digital SAT is shorter, lasting about 2 hours and 14 minutes instead of the previous 3-hour duration, and incorporates an adaptive testing model. The shorter length and adaptive model could potentially affect average scores as students adapt to the new format.
- Additionally, the effects of the COVID-19 pandemic continue to be visible in the performance of students. The disruptions in education during the pandemic led to gaps in learning for many students, contributing to a decline in average scores, as fewer students met the Math and EBRW benchmarks for college readiness.
- The overall lower score may also reflect the increased access to the SAT as the College Board moved towards making the test more accessible to a diverse range of students, including those from under-resourced schools who may not have had access to the same level of preparatory support.
Pandemic and Digital Transition (2020-2024):
The pandemic had a significant impact on learning outcomes, contributing to a decline in SAT performance. The shift to the digital SAT in 2024 also reflects a period of transition, with scores dropping to 1024 as students and schools adapted to the new digital, adaptive format.
How Does the New Digital SAT Test Differ from the Old SAT Test?
In 2024, the College Board introduced a digital SAT, which has a few key differences from the traditional paper-based version:
- Adaptive Format: The digital SAT uses an adaptive testing model. This means that the test adjusts the difficulty of questions based on the student’s performance in earlier parts of the test.
- Shorter Test Duration: The digital SAT is shorter, lasting about 2 hours and 14 minutes compared to the previous 3 hours for the paper-based test.
- Faster Results: Scores for the digital SAT are released more quickly, within days rather than weeks.
- Streamlined Questions: The digital SAT has fewer questions per section, but they are designed to provide the same insights into a student’s academic readiness.
- Security and Flexibility: Students can take the test on a computer or tablet, and the adaptive nature of the test prevents cheating by ensuring that each student gets a unique test experience.
Overall, the digital SAT is designed to be more accessible, student-friendly, and efficient.
How Long Does the SAT Test Take?
The 2024 digital SAT takes approximately 2 hours and 14 minutes to complete. This is a significant reduction in test length from the previous 3-hour paper-based version. Here’s a breakdown of the new digital SAT:
- Reading and Writing Section: 64 minutes (two stages of 32 minutes each)
- Math Section: 70 minutes (two stages of 35 minutes each)
This includes short breaks between sections, but the overall experience is streamlined to reduce fatigue while maintaining accuracy in testing students’ skills.
When Are SAT Scores Released? What Time Do SAT Scores Come Out?
SAT scores are generally released 2–3 weeks after the test date. However, with the new digital SAT, scores are expected to be available within days due to the efficiency of the digital format. This is much faster than the paper-based version.
Scores are typically released online through the College Board’s portal early in the morning, usually by 8:00 AM Eastern Time on the release date. You’ll receive an email notification when your scores are available.
SAT Percentile Chart for Composite SAT Scores.
Percentiles show how a student’s SAT score compares to other test-takers. Here’s a sample SAT percentile chart for composite scores.
Here is a detailed SAT Percentile Chart with more percentile breaks, including 99+, 99, 98, 96, 95, 90, 88, 85, 80, 75, and then every 5 percentile down to 5, with 2 and 1 percentiles included. The scores reflect approximate ranges for Evidence-Based Reading and Writing (EBRW), Math, and Total composite scores based on historical data:
| Percentile | EBRW Score Range | Math Score Range | Total Composite Score Range |
|---|---|---|---|
| 99+ (Best) | 760 and above | 790 and above | 1530 and above |
| 99 | 750-760 | 780-790 | 1510-1530 |
| 98 | 740-750 | 770-780 | 1490-1510 |
| 96 | 720-740 | 750-770 | 1460-1490 |
| 95 | 710-720 | 740-750 | 1440-1460 |
| 90 (Excellent) | 670-680 | 690-700 | 1350-1370 |
| 88 | 650-670 | 670-690 | 1320-1350 |
| 85 | 640-650 | 660-670 | 1300-1320 |
| 80 | 620-640 | 640-660 | 1260-1300 |
| 75 (Good) | 600-610 | 600-620 | 1200-1240 |
| 70 | 590-600 | 590-600 | 1180-1200 |
| 65 | 570-590 | 570-590 | 1140-1180 |
| 60 | 550-570 | 550-570 | 1100-1140 |
| 55 | 530-550 | 530-550 | 1080-1100 |
| 50 (Average) | 520-530 | 510-520 | 1050-1060 |
| 45 | 500-520 | 490-510 | 1020-1050 |
| 40 | 480-500 | 470-490 | 980-1020 |
| 35 | 460-480 | 450-470 | 950-980 |
| 30 | 450-460 | 430-450 | 920-950 |
| 25 (Below Average) | 440-450 | 430-440 | 870-900 |
| 20 | 410-440 | 400-430 | 820-870 |
| 15 | 390-410 | 380-400 | 770-820 |
| 10 (Poorer) | 370-390 | 350-370 | 720-770 |
| 5 | 340-370 | 320-350 | 690-720 |
| 2 | 330 and below | 310 and below | 670 and below |
| 1 (Poorest) | 310 and below | 300 and below | 650 and below |
Explanation:
99th percentile score means you scored higher than 99% of students, while a 50th percentile score is average, meaning you scored better than about half of the test-takers.
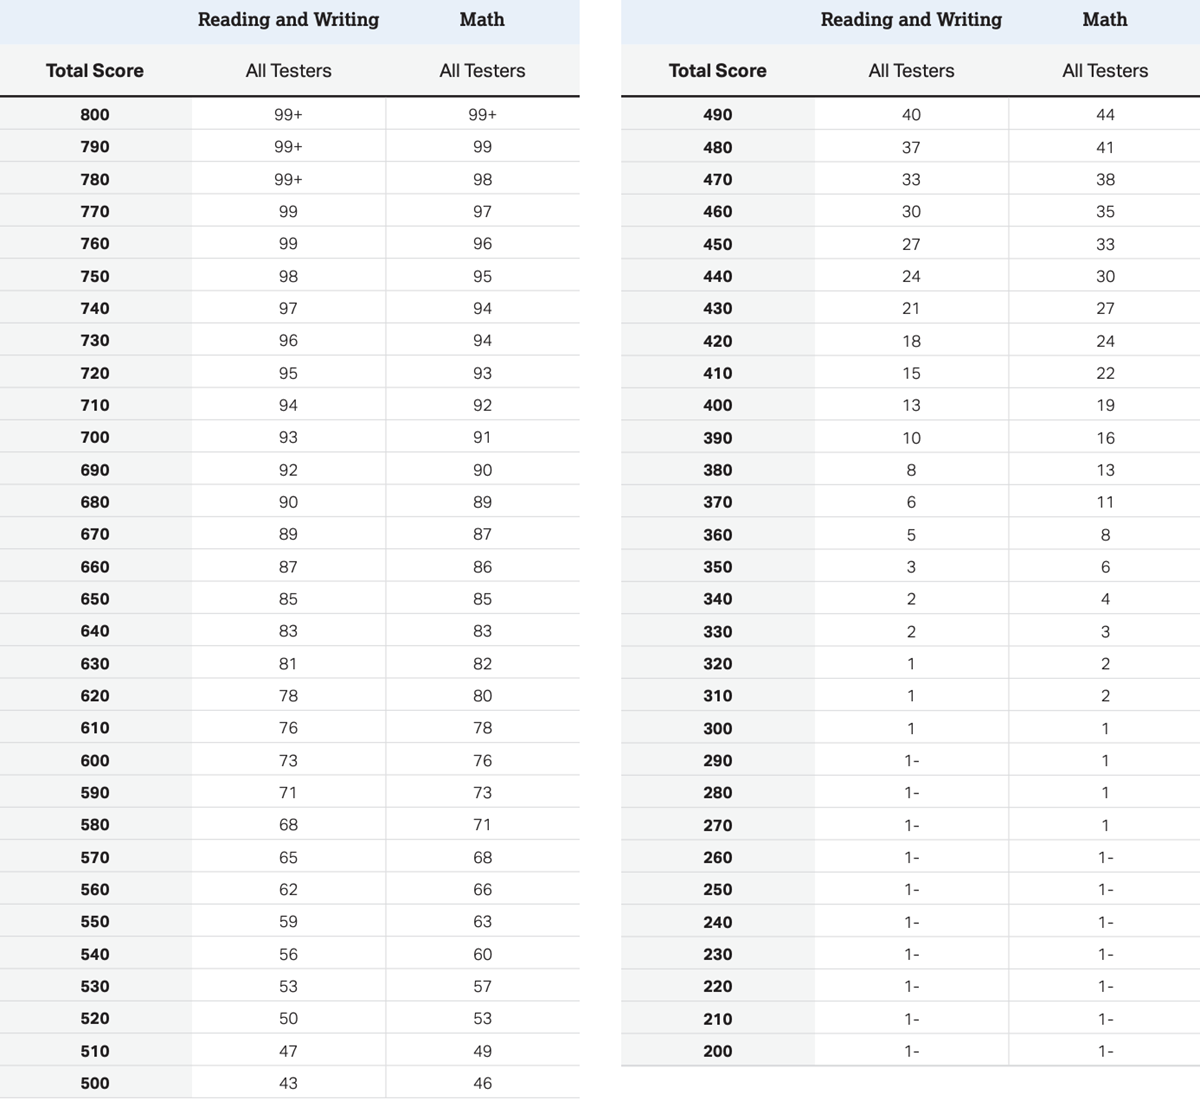
SAT Scores – Percentile Chart for Math and Reading-Writing.
We have added a SAT Score Percentile chart that shows percentiles for both the Math and Reading-Writing parts. Note, that the SAT score percentiles vary across the two Reading & Writing and Math sections. To understand the SAT Score Range, and your performance, look at both your Reading & Writing and Math scores, and their percentiles.
SAT Scores Percentiles Chart and Grade Letter Equivalent.
If you are not used to SAT scores and what a ‘good’, ‘average’ and ‘bad’ SAT score is, we have put together this chart that convert SAT scores to percentile scores, and the equivalent Letter Grade according to percentiles.
| SAT Score | Numerical Class Grade | SAT Score Percentiles (%) | Class Letter Grade |
|---|---|---|---|
| 1560-1600 | 100.0 | 99+ | A+ |
| 1520-1550 | 99.9 | 98-99+ | A+ |
| 1490-1510 | 99.8 | 97-98 | A+ |
| 1465-1480 | 99.7 | 96-97 | A+ |
| 1450-1460 | 99.6 | 96 | A+ |
| 1430-1440 | 99.5 | 95 | A+ |
| 1420 | 99.4 | 94 | A+ |
| 1410 | 99.3 | 94 | A+ |
| 1390-1400 | 99.2 | 93 | A+ |
| 1387 | 99.1 | 92 | A+ |
| 1370-1380 | 99.0 | 91 | A+ |
| 1367 | 98.9 | 91 | A+ |
| 1350-1360 | 98.8 | 90 | A+ |
| 1347 | 98.7 | 89 | A+ |
| 1340 | 98.6 | 89 | A+ |
| 1333 | 98.5 | 88 | A+ |
| 1327 | 98.4 | 88 | A+ |
| 1320 | 98.3 | 87 | A+ |
| 1310 | 98.2 | 87 | A+ |
| 1300 | 98.1 | 86 | A+ |
| 1293 | 97.9 | 85 | A+ |
| 1287 | 97.8 | 85 | A+ |
| 1280 | 97.7 | 85 | A+ |
| 1273 | 97.6 | 84 | A+ |
| 1267 | 97.5 | 83 | A+ |
| 1260 | 97.4 | 83 | A+ |
| 1253 | 97.2 | 82 | A+ |
| 1247 | 97.1 | 81 | A+ |
| 1240 | 97.0 | 81 | A |
| 1233 | 96.8 | 80 | A |
| 1227 | 96.7 | 79 | A |
| 1220 | 96.5 | 79 | A |
| 1213 | 96.4 | 77 | A |
| 1207 | 96.2 | 76 | A |
| 1200 | 96.0 | 76 | A |
| 1193 | 95.9 | 75 | A |
| 1187 | 95.7 | 74 | A |
| 1180 | 95.5 | 73 | A |
| 1173 | 95.3 | 73 | A |
| 1167 | 95.1 | 71 | A |
| 1160 | 94.9 | 71 | A |
| 1153 | 94.7 | 70 | A |
| 1147 | 94.5 | 69 | A |
| 1140 | 94.3 | 69 | A |
| 1133 | 94.1 | 67 | A |
| 1127 | 93.9 | 66 | A |
| 1120 | 93.7 | 66 | A |
| 1110 | 93.3 | 64 | A |
| 1100 | 93.0 | 63 | A- |
| 1093 | 92.7 | 61 | A- |
| 1087 | 92.5 | 60 | A- |
| 1080 | 92.2 | 60 | A- |
| 1073 | 91.9 | 58 | A- |
| 1067 | 91.7 | 57 | A- |
| 1060 | 91.4 | 57 | A- |
| 1053 | 91.1 | 55 | A- |
| 1047 | 90.8 | 54 | A- |
| 1040 | 90.5 | 54 | A- |
| 1033 | 90.2 | 52 | A- |
| 1027 | 89.9 | 51 | B+ |
| 1020 | 89.6 | 51 | B+ |
| 1013 | 89.3 | 49 | B+ |
| 1007 | 89.0 | 47 | B+ |
| 1000 | 88.7 | 47 | B+ |
| 993 | 88.4 | 46 | B+ |
| 987 | 88.1 | 46 | B+ |
| 980 | 87.8 | 44 | B+ |
| 973 | 87.5 | 43 | B+ |
| 967 | 87.2 | 41 | B |
| 960 | 86.9 | 41 | B |
| 953 | 86.6 | 40 | B |
| 947 | 86.2 | 40 | B |
| 940 | 85.9 | 38 | B |
| 933 | 85.6 | 37 | B |
| 927 | 85.3 | 37 | B |
| 920 | 84.9 | 35 | B |
| 913 | 84.6 | 33 | B |
| 907 | 84.3 | 32 | B |
| 900 | 83.9 | 32 | B |
| 893 | 83.6 | 30 | B |
| 887 | 83.2 | 30 | B |
| 880 | 82.9 | 29 | B- |
| 873 | 82.5 | 27 | B- |
| 867 | 82.1 | 26 | B- |
| 860 | 81.7 | 26 | B- |
| 853 | 81.3 | 24 | B- |
| 847 | 80.9 | 22 | B- |
| 840 | 80.4 | 22 | B- |
| 833 | 80.0 | 21 | C+ |
| 827 | 79.5 | 19 | C+ |
| 820 | 79.0 | 19 | C+ |
| 813 | 78.5 | 18 | C+ |
| 807 | 78.0 | 16 | C+ |
| 800 | 77.5 | 16 | C+ |
| 793 | 77.0 | 15 | C |
| 787 | 76.5 | 13 | C |
| 780 | 76.0 | 13 | C |
| 773 | 75.5 | 12 | C |
| 767 | 75.0 | 12 | C |
| 760 | 74.5 | 11 | C |
| 753 | 74.0 | 10 | C |
| 747 | 73.5 | 9 | C |
| 740 | 73.0 | 8 | C- |
| 733 | 72.4 | 7 | C- |
| 727 | 71.9 | 7 | C- |
| 720 | 71.3 | 6 | C- |
| 713 | 70.6 | 5 | C- |
| 707 | 69.8 | 5 | D+ |
| 700 | 69.0 | 4 | D+ |
| 693 | 68.1 | 3 | D+ |
| 687 | 67.3 | 3 | D+ |
| 680 | 66.4 | 3 | D |
| 673 | 65.5 | 2 | D |
| 667 | 64.6 | 2 | D |
| 660 | 63.6 | 2 | D |
| 653 | 62.5 | 1 | D |
| 647 | 61.2 | 1 | D |
| 640 | 59.3 | 1 | F |
| 633 | 57.2 | 1 | F |
| 627 | 55.2 | 1- | F |
| 620 | 53.1 | 1- | F |
| 613 | 51.2 | 1- | F |
| 607 | 49.2 | 1- | F |
| 600 | 47.3 | 1- | F |
| 593 | 45.4 | 1- | F |
| 587 | 43.5 | 1- | F |
| 580 | 41.7 | 1- | F |
| 573 | 39.9 | 1- | F |
| 567 | 38.1 | 1- | F |
| 560 | 36.3 | 1- | F |
| 553 | 34.6 | 1- | F |
| 547 | 32.8 | 1- | F |
| 540 | 31.1 | 1- | F |
| 533 | 29.5 | 1- | F |
| 527 | 27.9 | 1- | F |
| 520 | 26.4 | 1- | F |
| 513 | 24.8 | 1- | F |
| 507 | 23.4 | 1- | F |
| 500 | 21.9 | 1- | F |
| 493 | 20.4 | 1- | F |
| 487 | 18.9 | 1- | F |
| 480 | 17.5 | 1- | F |
| 473 | 16.1 | 1- | F |
| 467 | 14.7 | 1- | F |
| 460 | 13.4 | 1- | F |
| 453 | 12.1 | 1- | F |
| 447 | 10.9 | 1- | F |
| 440 | 9.7 | 1- | F |
| 433 | 8.6 | 1- | F |
| 427 | 7.7 | 1- | F |
| 420 | 6.6 | 1- | F |
| 413 | 5.7 | 1- | F |
| 407 | 5.0 | 1- | F |
| 400 | 3.2 | 1- | F |
The distribution of SAT scores and class grades is different, with a higher resolution at the top of the SAT scale. For example, both a 1250 and a 1600 on the SAT map to an A+, highlighting that SAT scores provide more differentiation at higher levels compared to class grades. While class grades and SAT scores are similar in distinguishing middle-level students, they differ significantly in measuring exceptional performance. Additionally, SAT scores rarely fall below 680, similar to how failing grades in classes are rare.
Mapping SAT scores to class grades is possible but not precise. SATs and class grades assess different things: the SAT is a short, standardized, multiple-choice test, whereas class grades are based on ongoing assessments involving interaction with teachers and peers. Additionally, class grading standards vary greatly between subjects and teachers, making it an imperfect comparison to SAT scores.
What is a Good Score for Ivy League Colleges and Universities?
Below we have compiled a table that provides the SAT score requirements for the top 50 schools in the United States. These values represent the middle 50% range of SAT scores, meaning that 25% of admitted students scored below this range, and 25% scored above it. The scores are split into the Evidence-Based Reading and Writing (EBRW) and Math sections.
SAT Score Requirements for the Top 50 Colleges and Universities in the USA:
| Rank | University | SAT Score Range (EBRW) | SAT Score Range (Math) | Total SAT Score Range (Middle 50%) |
|---|---|---|---|---|
| 1 | Princeton University | 740 – 800 | 750 – 800 | 1490 – 1600 |
| 2 | Massachusetts Institute of Technology (MIT) | 730 – 780 | 780 – 800 | 1510 – 1580 |
| 3 | Harvard University | 730 – 790 | 740 – 800 | 1470 – 1590 |
| 4 | Stanford University | 720 – 780 | 740 – 800 | 1460 – 1580 |
| 5 | Yale University | 740 – 790 | 740 – 800 | 1480 – 1590 |
| 6 | University of Chicago | 730 – 790 | 750 – 800 | 1480 – 1590 |
| 7 | Columbia University | 730 – 790 | 740 – 800 | 1470 – 1590 |
| 8 | California Institute of Technology (Caltech) | 750 – 800 | 780 – 800 | 1530 – 1600 |
| 9 | University of Pennsylvania | 720 – 780 | 740 – 790 | 1460 – 1570 |
| 10 | Northwestern University | 720 – 770 | 740 – 790 | 1460 – 1560 |
| 11 | Johns Hopkins University | 730 – 780 | 740 – 790 | 1470 – 1570 |
| 12 | Dartmouth College | 720 – 770 | 730 – 790 | 1450 – 1560 |
| 13 | Brown University | 720 – 780 | 740 – 790 | 1460 – 1570 |
| 14 | Vanderbilt University | 720 – 770 | 740 – 790 | 1460 – 1560 |
| 15 | Rice University | 730 – 780 | 740 – 790 | 1470 – 1570 |
| 16 | Washington University in St. Louis | 720 – 770 | 740 – 800 | 1460 – 1570 |
| 17 | Cornell University | 700 – 760 | 720 – 780 | 1420 – 1540 |
| 18 | University of Notre Dame | 710 – 770 | 720 – 780 | 1430 – 1550 |
| 19 | University of California, Berkeley | 680 – 750 | 690 – 780 | 1370 – 1530 |
| 20 | University of California, Los Angeles (UCLA) | 680 – 740 | 690 – 780 | 1370 – 1520 |
| 21 | Emory University | 710 – 770 | 710 – 770 | 1420 – 1540 |
| 22 | University of Michigan, Ann Arbor | 680 – 750 | 700 – 780 | 1380 – 1530 |
| 23 | Georgetown University | 710 – 770 | 700 – 760 | 1410 – 1530 |
| 24 | University of Virginia | 690 – 740 | 700 – 770 | 1390 – 1510 |
| 25 | Carnegie Mellon University | 720 – 760 | 760 – 800 | 1480 – 1560 |
| 26 | University of Southern California | 700 – 760 | 700 – 770 | 1400 – 1530 |
| 27 | University of North Carolina, Chapel Hill | 660 – 730 | 670 – 750 | 1330 – 1480 |
| 28 | Wake Forest University | 690 – 740 | 700 – 760 | 1390 – 1500 |
| 29 | New York University (NYU) | 690 – 740 | 700 – 770 | 1390 – 1510 |
| 30 | University of Florida | 660 – 730 | 670 – 750 | 1330 – 1480 |
| 31 | Tufts University | 710 – 760 | 720 – 780 | 1430 – 1540 |
| 32 | University of Rochester | 670 – 740 | 680 – 770 | 1350 – 1510 |
| 33 | Georgia Institute of Technology (Georgia Tech) | 680 – 730 | 720 – 780 | 1400 – 1510 |
| 34 | Boston College | 670 – 740 | 690 – 760 | 1360 – 1500 |
| 35 | University of Wisconsin-Madison | 640 – 710 | 650 – 740 | 1290 – 1450 |
| 36 | University of Texas at Austin | 620 – 700 | 630 – 720 | 1250 – 1420 |
| 37 | Northeastern University | 690 – 750 | 700 – 770 | 1390 – 1520 |
| 38 | Boston University | 670 – 740 | 680 – 760 | 1350 – 1500 |
| 39 | University of Georgia | 640 – 710 | 650 – 730 | 1290 – 1440 |
| 40 | Ohio State University | 610 – 690 | 620 – 700 | 1230 – 1390 |
| 41 | Purdue University | 600 – 680 | 610 – 700 | 1210 – 1380 |
| 42 | University of Miami | 650 – 720 | 660 – 730 | 1310 – 1450 |
| 43 | Michigan State University | 590 – 660 | 600 – 680 | 1190 – 1340 |
| 44 | Penn State University | 610 – 680 | 620 – 700 | 1230 – 1380 |
| 45 | Syracuse University | 610 – 680 | 620 – 690 | 1230 – 1370 |
| 46 | University of Connecticut | 620 – 690 | 630 – 700 | 1250 – 1390 |
| 47 | University of Illinois Urbana-Champaign | 630 – 700 | 650 – 740 | 1280 – 1440 |
| 48 | University of Washington | 620 – 690 | 630 – 720 | 1250 – 1410 |
| 49 | Indiana University Bloomington | 600 – 670 | 610 – 690 | 1210 – 1360 |
| 50 | University of Maryland, College Park | 640 – 710 | 650 – 730 | 1290 – 1440 |
General SAT Score Ranges for the Top 51-100 Schools:
- 51-75: SAT Total Score Range (Middle 50%) generally falls between 1200 – 1400.
- 76-100: SAT Total Score Range (Middle 50%) generally falls between 1100 – 1300.
These ranges are based on historical data and can fluctuate year to year. They are intended to provide a general guide for prospective students, but it is always best to check each university’s website for the most current and specific admission requirements. Additionally, universities consider various other factors beyond SAT scores for admissions, such as GPA, extracurricular activities, essays, and recommendation letters.
Notes:
- Total SAT Score Range (Middle 50%): This represents the middle 50% of scores for admitted students, meaning half of the admitted students scored within this range.
- These ranges are based on data provided by the universities and may change annually, and are based on the 2023-2024 admissions cycle. Applicants are encouraged to check the latest requirements directly from the university websites.
- These schools are highly competitive, and having an SAT score within or above the range significantly increases the likelihood of being accepted, but other factors such as GPA, extracurricular activities, essays, and recommendations are also considered.
SAT Scores – FAQ.
Frequently asked questions and answers about SAT Scores.
What Does SAT Stand For?
The SAT originally stood for “Scholastic Aptitude Test” but has since evolved and is no longer an acronym. It is simply referred to as the SAT. It was developed to measure students’ readiness for college and is widely used as part of the college admissions process in the United States.
What Does the SAT Measure?
The SAT measures a student’s readiness for college by assessing key academic skills:
Evidence-Based Reading and Writing (EBRW): This section tests reading comprehension, grammar, vocabulary in context, and the ability to analyze passages critically.
Math: The Math section measures proficiency in algebra, problem-solving, data analysis, and some elements of geometry and trigonometry. The test aims to evaluate a student’s skills in areas that are crucial for academic success in college.
What Is the Format of the SAT?
The SAT is divided into two main sections:
Evidence-Based Reading and Writing (EBRW):
Reading Test: Consists of passages with multiple-choice questions that assess reading comprehension, vocabulary, and critical reasoning.
Writing and Language Test: Involves editing and improving passages to test grammar, usage, and rhetorical skills.
Math:
Consists of two parts: Math with Calculator and Math without Calculator.
Includes topics such as algebra, problem-solving, data analysis, and trigonometry.
The SAT also had an optional Essay section, but it was discontinued in 2021.
What Is the Scoring Range for the SAT?
The total SAT score ranges from 400 to 1600, consisting of:
Evidence-Based Reading and Writing (EBRW): 200 to 800 points
Math: 200 to 800 points
The two sections are combined to provide the overall score.
How Are SAT Scores Calculated?
Raw Score: The SAT is scored by calculating the number of correct answers (raw score). There is no penalty for wrong answers.
Scaled Score: The raw scores for EBRW and Math are then converted to scaled scores ranging from 200 to 800 for each section. The scaling process accounts for differences in difficulty between different test versions, ensuring fairness.
The total score is the sum of the scaled scores from EBRW and Math, with a range of 400 to 1600.
How Do Percentiles Work in SAT Scores?
Percentiles help compare a student’s performance against others:
For example, scoring in the 90th percentile means that the student scored higher than 90% of all test-takers.
Percentiles are provided in score reports to give context to where a student stands relative to other students.
What Is a Good SAT Score?
A “good” SAT score depends on the colleges a student is applying to.
Top-tier universities (e.g., Ivy League schools) often expect scores in the range of 1450-1600.
A score of 1200-1400 is considered competitive for many public and private universities.
The national average SAT score is typically around 1050.
What Is the Average SAT Score?
The average SAT score for recent years has been around 1050. This average is the sum of the average EBRW score (about 530) and the average Math score (about 520). The average can vary slightly depending on the testing year and the student population taking the exam.
What Is the SAT Benchmark?
The SAT benchmarks are scores that indicate a student’s likelihood of success in college-level courses:
ERW Benchmark: A score of 480 indicates college readiness in reading and writing.
Math Benchmark: A score of 530 indicates college readiness in mathematics.
Meeting these benchmarks suggests that a student is prepared to succeed in entry-level college courses.
How Long Is the SAT?
The SAT takes approximately 3 hours to complete:
Reading Test: 65 minutes
Writing and Language Test: 35 minutes
Math Test: 80 minutes
In addition, there are short breaks between sections.
With the discontinuation of the optional Essay, the overall test time was reduced.
What Is the Digital SAT?
The digital SAT, introduced in 2024, is a fully computer-based version of the SAT. The digital SAT has:
A shorter duration of about 2 hours and 14 minutes.
An adaptive testing format that adjusts the difficulty level based on the student’s performance.
Faster score delivery compared to the paper-based SAT.
When Are SAT Scores Released?
SAT scores are typically released 2-3 weeks after the test date.
With the new digital SAT, scores are expected to be available within days of the test.
Students can view their scores on the College Board website, and most scores are released in the morning (around 8:00 AM ET).
What Time Do SAT Scores Come Out?
SAT scores are usually released online by 8:00 AM Eastern Time on the release date. Students receive an email notification when their scores are available.
How Do Colleges Use SAT Scores?
Colleges use SAT scores as part of their admissions process to evaluate a student’s academic readiness. Other factors include:
High School GPA
Extracurricular Activities
Personal Essays
Letters of Recommendation SAT scores are also used for awarding scholarships and placing students in appropriate courses.
Can You Retake the SAT?
Yes, students can retake the SAT as many times as they like. Most students take the SAT 2-3 times to improve their scores.
Colleges often consider the highest score across multiple sittings, and some colleges use Superscoring, which takes the highest section scores from different test dates to create a new composite score.
What Is Superscoring?
Superscoring is when a college combines the highest EBRW and Math scores from multiple SAT test dates to create a new superscore. This allows students to present their best performance for each section, potentially increasing their competitiveness.
Should You Take the SAT or the ACT?
Both the SAT and the ACT are widely accepted by U.S. colleges, and students should choose the one that suits their strengths.
The SAT focuses more on evidence-based reading and problem-solving, while the ACT includes a Science section and generally has a faster-paced structure.
Students can take practice tests for both exams to determine which one suits them better.
How Can You Prepare for the SAT?
Practice Tests: Take full-length practice tests to become familiar with the test format.
Study Materials: Use prep books, online resources, and study guides.
Courses and Tutoring: Many students take SAT prep courses or hire tutors for personalized support.
Khan Academy: The College Board partners with Khan Academy to provide free, personalized SAT practice to all students.
How Much Does the SAT Cost?
The standard SAT fee is around $60 (subject to change).
Fee waivers are available for eligible students, which cover the test fee and provide additional benefits, such as free score reports and college application fee waivers.
Can You Cancel Your SAT Scores?
Yes, students can cancel their SAT scores if they feel they did poorly.
This must be done immediately after the test, typically within a few days of taking the exam, by submitting a written request to the College Board.
What Are SAT Score Reports?
SAT Score Reports provide detailed information about a student’s performance.
They include section scores (Math and EBRW), subscores for specific skill areas, and percentile rankings.
Score reports are sent to colleges as part of the admissions process, and students can select up to four colleges to receive their scores for free when registering for the SAT.
How Long Are SAT Scores Valid?
SAT scores are valid for five years. After that, the scores may become less representative of a student’s current academic abilities, and some colleges may not accept scores older than five years.
Is 1600 a Good SAT Score?
A score of 1600 is a perfect SAT score. This score places you in the 99th+ percentile, meaning you scored better than 99% of all test-takers. A 1600 is highly competitive for any college or university in the United States, including Ivy League schools, MIT, and Stanford. This score demonstrates exceptional mastery of the material.
Is 1550 a Good SAT Score?
A score of 1550 is an excellent SAT score, typically placing you in the 99th percentile. This score makes you a competitive applicant for the most selective colleges and universities, including Ivy League institutions. It shows that you have a strong grasp of the skills tested on the SAT.
Is 1500 a Good SAT Score?
A score of 1500 is also an excellent score, placing you in the 98th-99th percentile. This score makes you highly competitive for most colleges, including many top-tier schools. A 1500 demonstrates that you are well-prepared academically.
Is 1450 a Good SAT Score?
A score of 1450 is a very good SAT score, placing you in the 96th percentile. This score is competitive for many top 20 schools and shows that you have a strong understanding of the material. It can make you a strong candidate at selective institutions.
Is 1400 a Good SAT Score?
A score of 1400 is a great score, placing you in the 94th percentile. This score makes you a competitive applicant for many selective universities and demonstrates strong academic ability. It is well above the national average and shows readiness for college-level work.
Is 1350 a Good SAT Score?
A score of 1350 is an above-average SAT score, typically placing you in the 90th percentile. This score is competitive for many public universities and some selective private colleges. It shows a good understanding of the material tested on the SAT.
Is 1300 a Good SAT Score?
A score of 1300 is an above-average score, placing you in the 86th percentile. This score is competitive for a range of universities, including some state flagship schools. It indicates solid academic preparation and readiness for college-level work.
Is 1250 a Good SAT Score?
A score of 1250 is an above-average score, placing you in the 81st percentile. It is a good score that can make you competitive for many universities, particularly state schools and less selective private institutions. It reflects good academic ability.
Is 1200 a Good SAT Score?
A score of 1200 is a good score, placing you in the 74th percentile. This score is above the national average and makes you a competitive applicant for a range of public universities and some less selective private colleges.
Is 1150 a Good SAT Score?
A score of 1150 is an average to above-average score, placing you in the 66th percentile. It can make you competitive for many state universities and some liberal arts colleges, though more selective schools may require higher scores.
Is 1100 a Good SAT Score?
A score of 1100 is an average score, placing you in the 58th percentile. It is acceptable for admission to many public universities and community colleges but may not be competitive for more selective institutions.
Is 1050 a Good SAT Score?
A score of 1050 is slightly below average, placing you in the 50th percentile. This score is generally enough for many less selective colleges and universities but may limit your options if applying to more competitive programs.
Is 1000 a Good SAT Score?
A score of 1000 is considered below average, placing you in the 41st percentile. While it may be acceptable for some less selective institutions, it will not be competitive for most state flagship schools or more selective colleges.
Is 950 a Good SAT Score?
A score of 950 is below average, placing you in the 33rd percentile. This score may be enough for admission to some community colleges and less selective universities, but it will not be competitive for most four-year institutions.
Is 900 a Good SAT Score?
A score of 900 is below average, placing you in the 25th percentile. This score is on the lower end of the range and may limit your college options to community colleges or non-selective institutions.
Is 850 a Good SAT Score?
A score of 850 is in the 18th percentile, indicating that you scored better than only 18% of test-takers. This score is generally too low for most four-year colleges but may be sufficient for some community colleges or open-admissions programs.
Is 800 a Good SAT Score?
A score of 800 is in the 12th percentile, which is significantly below average. It indicates that you may need additional preparation before pursuing college-level coursework and may limit your options to open-admission or community colleges.
Is 750 a Good SAT Score?
A score of 750 places you in the 7th percentile, which is very low. It indicates significant gaps in knowledge and may require remediation before attending a four-year college. Community colleges may still be an option with this score.
Is 700 a Good SAT Score?
A score of 700 places you in the 4th percentile, indicating that you scored better than only 4% of test-takers. This score is quite low and may limit your options to community colleges or open-admission institutions that offer preparatory programs.
Is 650 a Good SAT Score?
A score of 650 places you in approximately the 2nd percentile, meaning that you scored better than only about 2% of test-takers. This is a very low score, and it suggests significant gaps in your knowledge. With a score of 650, your options for admission are likely limited to community colleges or open-admission institutions that provide preparatory programs.
Is 600 a Good SAT Score?
A score of 600 places you in approximately the 1st percentile, which is one of the lowest possible scores. This indicates that you may need significant improvement before being prepared for college-level work. With this score, community colleges and open-admission schools may be your best options, especially those that offer remedial courses to help bridge knowledge gaps.

hey, can anyone tell me if a 1450 is good enough for ivy leagues? saw in the article about good SAT scores for top schools, but still kinda confused if it’s enough or should i retake?
hey TommyG, 1450 is definitely solid but for ivies, higher always helps. maybe try again if you feel you can improve. good luck!
whats the average sat score these days? my kid’s taking it soon and were trying to set a target score, thanks in advance.
reading about all these scores and percentiles makes me grateful i chose writing. who needs math when you have metaphors, right?
Metaphors won’t help when you need to calculate your royalties, MizLiz. Just saying.
yo, saw the part about digital SATs being different. that sounds cool, does it mean we get to do it on tablets or something? tech is so neat.
i took the SAT way back, and all these new changes just seem like ways to make things more complicated. why fix something if it ain’t broke, you know?
Changes are good, Dave. It keeps things fair and up-to-date with how students learn today. It’s not complicating; it’s evolving.